Search results
-

Stable returns vs Eco and maturity
as of my understanding TT% = Loot / (Cost + decay) TT% is about 95% and had a very high variance. With "stable returns" they've lowered this variance and this has nothing to do with eco. The more decay the less TT% but now with less variance (volatility). Hence same expected mean. -
New Mining or Old Mining?
I prefer the new system because nobody knows all the details yet.- falkao
- Post #28
- Forum: Mining & Resource Gathering
-
Serica Pre/Post 2013 R2
- falkao
- Media item
- Comments: 0
- Category: Misc pics (EU related ONLY)
-
Serica Pre/Post 2013
- falkao
- Media item
- Comments: 0
- Category: Misc pics (EU related ONLY)
-
mining data 2012
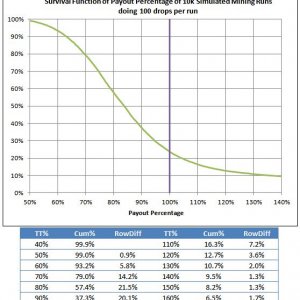
I’ve posted some simulated data of new mining loot for long term results before (>1k drops). As we do have a lots of posts claiming bad returns on 100 drops, it might be good to look at the respective simulated data (fig.1). Only 23.6% of runs will be above 100% TT and only 13.7% of runs will...- falkao
- Post #240
- Forum: Loot Theories
-
Simulated Mining data 100 drops
- falkao
- Media item
- Comments: 0
- Category: Misc pics (EU related ONLY)
-
Stop the Modified Loot!
There are still exceptional finds but their value is now lower and I further do assume that their freq is the same or only slightly lower. If you do get a 25PED find nowadays it is comparable to an old 50 PED one.- falkao
- Post #67
- Forum: General Economy Discussion
-
mining data 2012
We have compared in 2010 MF-105 (1.8 PEC decay, depth 522, now F-105) with Jul 10 (decay .75, depth 204, now Ziplex Z1) and there was neither a difference in hitrate nor in TT returns. Hence, the quite large difference in decay was not reflected in TT. This however does not exclude, that other...- falkao
- Post #238
- Forum: Loot Theories
-
mining data 2012
if I recall correctly, there was also one observation where one was able to get lyst from an area normally not having it by using a low depth or decaying finder.- falkao
- Post #233
- Forum: Loot Theories
-
-
mining data 2012
I do remember that and it was hard to judge what was going on. Those low decaying, low depth finders where present in ore mining. You do find them still as MD-40, MD-50. The difference in decay is however very small, so that the contribution to loot value is unclear. Unfortunately, there is no...- falkao
- Post #230
- Forum: Loot Theories
-
Stop the Modified Loot!
We've noticed the contrary. Mining loot seems less volatile and has better mean return when doing a lower number of drops.- falkao
- Post #15
- Forum: General Economy Discussion
-
mining data 2012
There is not that much data about different finders and decay. The data we do have doesn't show a finder effect on size. What holds true on finders is the more decay, the more depth. Hence, if you're after rare or higher MU resources, then you have to pay this with decay. I won't exclude...- falkao
- Post #228
- Forum: Loot Theories
-
mining data 2012
numbered 1) to 3); the systems looks random and hence there is no trace of a personal loot pool. The system returns basically all PED's consumed by probes and amp (therefore the mean of 0.5 PED per drop per standardized loot). What you don't get back is decay on finder, decay on driller and...- falkao
- Post #226
- Forum: Loot Theories
-
mining data 2012
You've got swirlies from size 12 on. If they start them now with size 10 (about 22 PED in mean) it would be a similar feeling. Also size 11 (25.5 PED in mean) might be a good start. Btw, does somebody have collected recent size-ped data? The relation so far was something like meanPED(size) =...- falkao
- Post #223
- Forum: Loot Theories
-
mining data 2012
There are now less classes where you can lose, therefore there are now less PEDs thet can be returned as globals. Overall payout is now much quicker hence you have to drop less to get the same payout %. Probably it would be sufficient to lower global svirlies to say 25 PED to get the same...- falkao
- Post #218
- Forum: Loot Theories
-
mining data 2012
As it looks atm, the main change was to move freq. from size 5-8 to size 9. Hence freq. of mini/globals should be the same. On the other site, payback till size 9 was about 62% so far, now it is about 90%. Hence the value that globals will drop might be quite less. Is this what you dislike, as...- falkao
- Post #210
- Forum: Loot Theories
-
mining data 2012
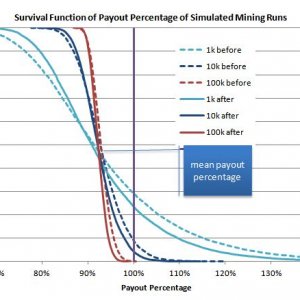
I've tried to get an idea about the change doing some simulations. Please note: the simulations for the change are based on the first impressions that we've got. Hence it is only a vague idea and might change with more data. Fig.1 Simulated mining runs with 1k, 10k and 100k drops repeated 10k...- falkao
- Post #207
- Forum: Loot Theories
-
Simulated Mining data before/after
- falkao
- Media item
- Comments: 0
- Category: Misc pics (EU related ONLY)
-
mining data 2012
Might be related to the TEN, but who knows. Went out myself and got quite some class 2 finds. Hit rate was high but sample size is still too small to conclude something. We will see how this change will be perceived.- falkao
- Post #200
- Forum: Loot Theories
-
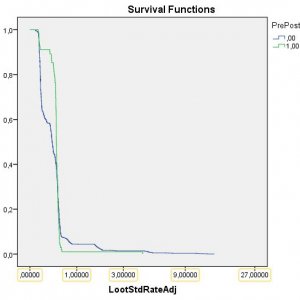
Serica Pre/Post Surv
- falkao
- Media item
- Comments: 0
- Category: Misc pics (EU related ONLY)
-
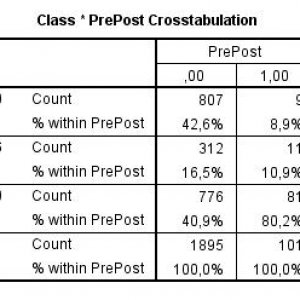
mining data 2012
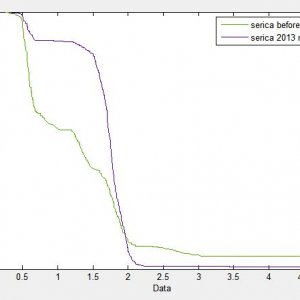
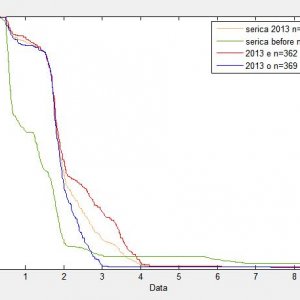
Here is Serica's Pre/Post February data. Also there is a significant difference in class frequencies (p<.001) with a higher class 2 frequency. Please note, that I've only considered the first 3 classes as there were no finds larger than class 2 yet in February. Hence the given percentages do...- falkao
- Post #198
- Forum: Loot Theories
-
Serica Pre/Post
- falkao
- Media item
- Comments: 0
- Category: Misc pics (EU related ONLY)
-
mining data 2012
As most is size 9, I'm wondering where the problem is. If your data is correct then there is less volatility. I've added some comments in my previous post.- falkao
- Post #197
- Forum: Loot Theories
-
mining data 2012
We had analyzed data from 2012 and compared it to 2008. You're comparing Jan 2013 to Feb 2013. This is how it looks like and the rel. frequencies are statistically significantly different (p<.001, Chi-Square Test). Hence size 9 is now more frequent and 5 to 8 are less. Cumulative freq. till...- falkao
- Post #194
- Forum: Loot Theories