Jhereg
Elite
- Joined
- Dec 13, 2005
- Posts
- 3,009
- Society
- Rangers
- Avatar Name
- Feng Huan SecretAznMan Zho
Update 20220911: I have measured the effect on TT at three additional looter level points, using my method of extracting the lowest multiplier and with the reaper blade. The observed trend is still the same. I have placed the data at the end of this point along with a brief description.
A quick preface.
There's a lot of bad information out there. As with everything, take what you read with a grain of salt. I've decided to share this, mostly because I think it would be fun to see what reactions I'm going to get out of this. But I've started to lose motivation for playing this game, because it has become an endless grind and because it was no longer about knowledge and science, but beliefs. "In God we trust, all others must bring data."
There are those who think knowledge is power and should be consolidated to lift oneself above the others. I think knowledge is power, but can be used to lift everyone up instead. The data below was the culmination of about two weeks of work and subsequent analysis, and a couple particularly helpful lightbulb moments. It was hard work, but without some critical thinking, we might still be at the "We need a million data points in order to get any real idea of your returns" phase.
Thanks to @miathan for providing the python script for parsing and tabulating the data, and @minim for their input in data as well.
Motivation: To determine the impact of efficiency and looter level on tt returns, and tease out any obvious trends.
Procedures:
Weapons with three different efficiencies were selected (92.5%, 62.8%, and 29.5%). Each weapon was run on three different mobs (bristlehog, drones, thorifoid berserkers) where I was able to hunt without armor and healing (using lifesteal). The distribution in multipliers were extracted and analyzed. The main region of interest of the distribution fell beneath 1.0x, so see the figure below for an example of such a distribution:
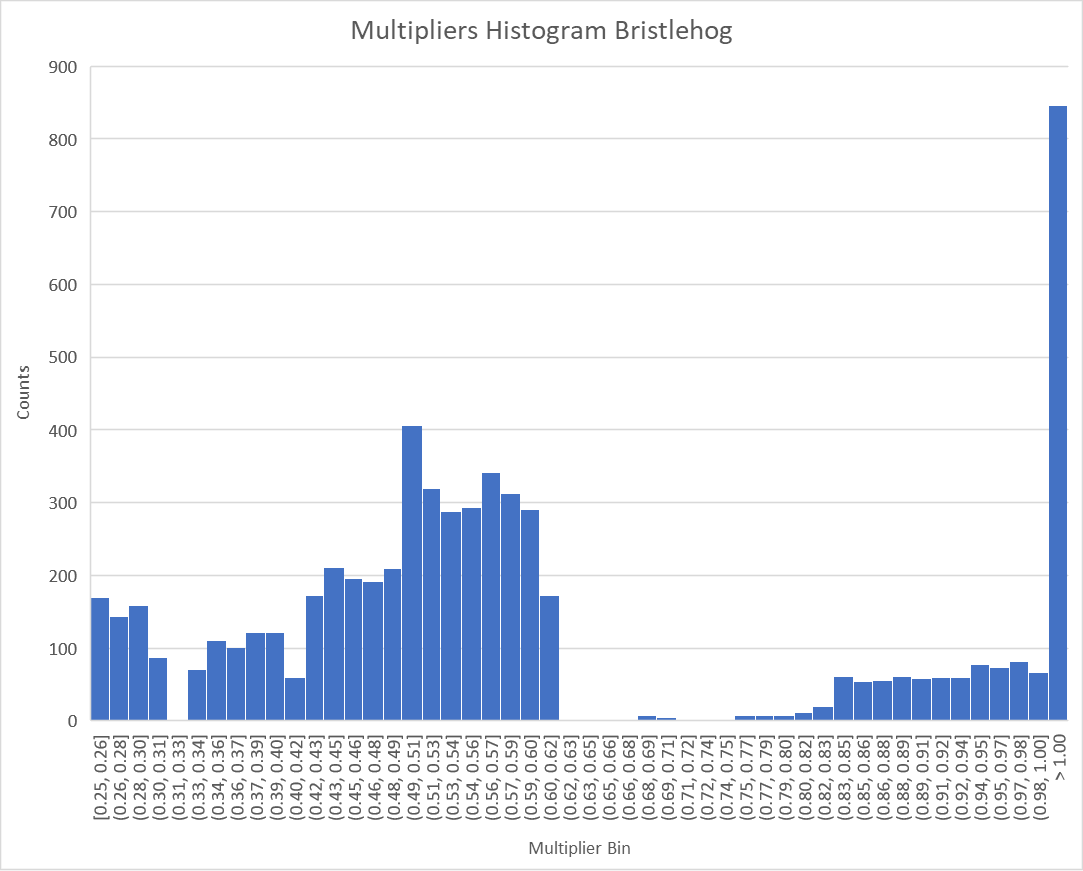
As you can see, the multipliers distributions have groupings. By analyzing the mean and standard deviation of the most populated grouping (Between ~.33x and .63x), we can try to find some trends in looter/efficiency behavior...
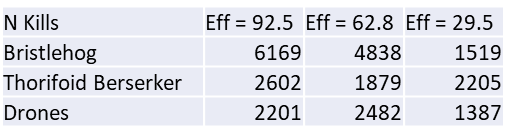
Number of kills (samples) performed in each case is shown in the table below:
While I was able to get some really decent results by analyzing only certain multiplier groupings, or certain fractions of the multiplier groupings (e.g. the bottom 2% of multipliers in a group), it did become apparent that I would need maybe quadruple the number of data points to get data that was going to be clean enough. While this is not on the order of 1 million kills, this was still very time consuming and I wasn't about to throw another 5 weeks into this project if I didn't have to.
At this point, I realized that instead of trying to statistically analyze the mean/sigma of the distribution, I could take the very bottom multiplier I got out of the entire sample. and this generally behaved extremely nicely and within my expectations for pretty much all the samples. While not as statistically robust, I found this method to give me the best results, so this is what I went with. The resulting data is in the following figures and explanations.
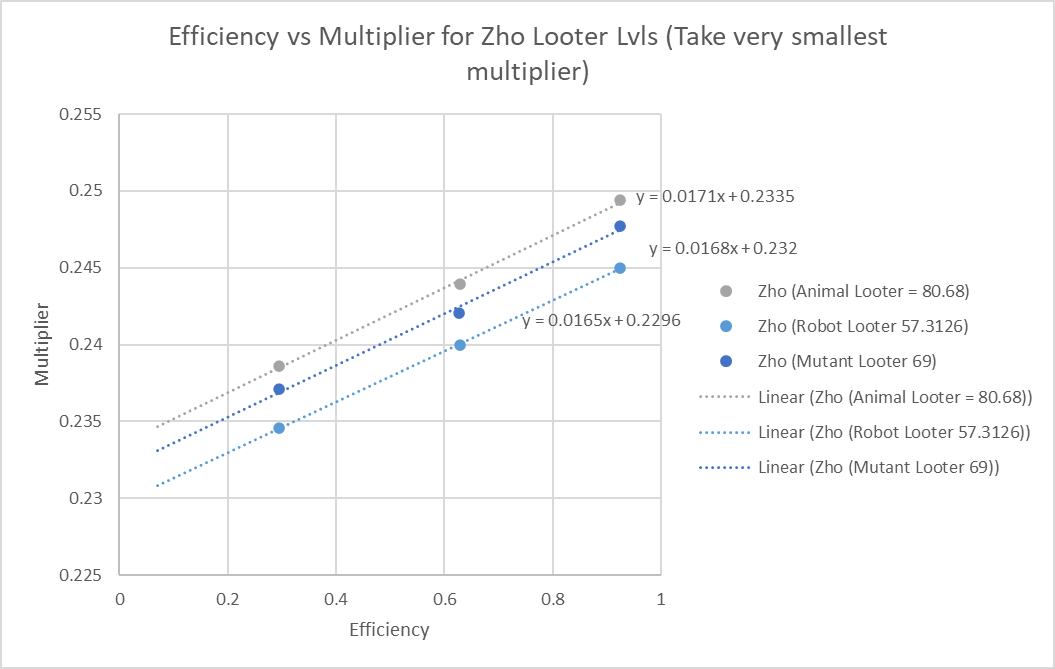
As you can see, at all the looter levels considered here, efficiency scales linearly. The slope here represents the impact of efficiency on the multiplier. If we take the slopes and divide by the y intercept, we get 7.25%. As MA has stated before, the expected efficiency effect is about 7% full range, so this value seems to align well with what MA has suggested before, as well as my previous turret testing when extrapolated out to 100%.
Teasing out the impact of looter is a bit more complicated but as we can see here, there's an obvious effect of looter levels on multipliers and it is very apparent. We can take the intercept and plot them on another plot. This would effectively represent looter impact at 0 efficiency:
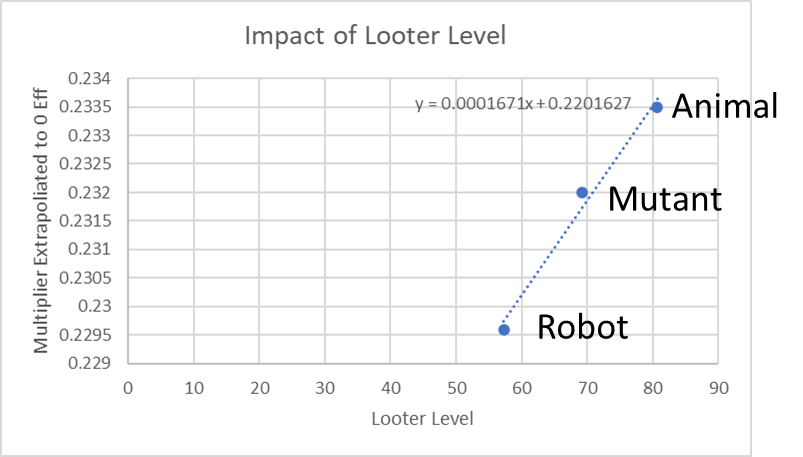
I was quite happy to see that the points all fell on a line. I had some doubts about whether all the professions for looter fell on the same scale, but would seem that they do, which simplifies testing. To consider the effect of looter up to lvl 80 animal looter which is what I have, I take the slope here(.0002) (.000167), multiply by 80, and divide by the expected multiplier for animal looter at eff=0 (.2335) based on the previous plot. When you do that, you get 6.9% 5.73%. So the expected improvement from 0 to lvl 80 looter is ~7% 5.73% TT return, assuming this linear behavior occurs over the entire range. If we take this value and scale it for the entire 0-100 looter level range, it comes out to about 7.2%. We have no expectations from MA of what looter does so I have nothing to compare this against. But I can say that my animal looter represents a ~1.65% better tt return than robot looter...
It is quite interesting that it appears the impact of looter level and efficiency are approximately equal in scaling between 0 and 100...
Discussion (Take these with a grain of thought, as some of this is based on my opinion of what the looter system might look like extrapolated out to higher levels.)
Based on this data, it appears that both efficiency effect and looter effect are linear. In addition, robot, mutant, and animal looter all appear to lay along on the same scale.
Assuming MA had foresight based on what problems loot1.0 caused, I'd expect some capping eventually of looter level effect. (No proof of this, until I can get to higher looter level). But based on other aspects of the game having lvl100 as a max (eff, weapon reqs), lvl 100 doesn't seem to be unreasonable. Again, I'd have to test this as my looter level moves up.
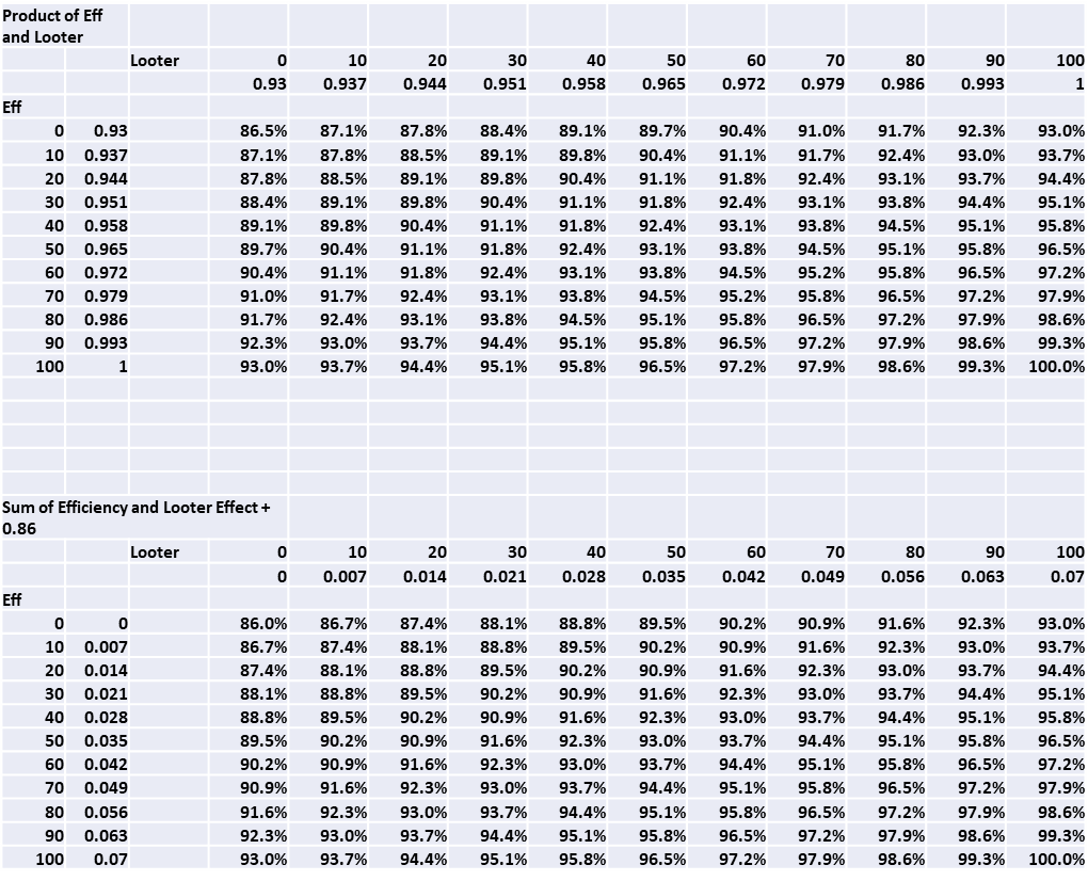
Just for shits and giggles, I assumed at lvl 100 + eff 100 is 100% TT return. I built a table with either the impacts either being multiplicative or additive ( so looter effect times efficiency effect versus looter effect plus efficiency effect). Here's what it might look like...totally just for fun. While this represents the trend, I have no idea what the tt return should be at 100 looter and 100% efficiency so this is just a proposed possibility
<ERRATA'ed: NEW TABLE, taking into account 7% effect over looter range 0-100 instead of 8.5%...)
Hopefully, this will help elucidate some stuff about eff and looter.
Many others who have been willing to take the time to collect the data, and then to share it with the player base have come before me, and I hope there will be others who share this path with me. I hope to work with others to understand better the mechanics in EU in the future.
Yours truly,
Zho
20220303: Errata: Adjusted looter vs multiplier line to show larger number of decimal places, which reduced the amount of looter prof effect on tt return. I have updated the post to reflect the updates.
20220911 Update: I was able to perform the test at three additional points as my looter level has increased. The same method was used as before, where I extract the lowest multiplier out of a set of mob kills using the reaper blade. The number of samples (kills) at each looter level is shown below, along with the raw data. For the most recent data (highlighted in yellow), since I used reaper blade only and did not bother with additional weapons, I took my previous results showing that 0-100 efficiency results in ~7.25% TT difference, and extrapolated my new data to 0% efficiency to match my previous data which I extracted using a line fit and grabbing the y-intercept.

The plot with a linear fit is below:

Based on the data above, we can assume the linear trend is true at least up to level 87 looter which is my highest looter level. The above slope translates to ~7.17% from 0-100 looter level, which agrees with my previous result with only 3 points. All different looter profession levels look to fall on the same line, so my guess that all looters are on the same scale still holds. Finally, I did switch up the robot looter points from drones to drill bots. This test shows that mobs on different planets should have the same returns, as the point falls right along the line, as expected. Finally, I continue to see the same impact from high efficiency, so I do not see any evidence of efficiency having less impact at higher looter.
My next test probably won't happen until I hit level 100 animal looter, as I see no point testing until I get there. The next goal would be to see if there is an actual cap on looter impact at level 100, and also see if anything about efficiency changes at 100+.
A quick preface.
There's a lot of bad information out there. As with everything, take what you read with a grain of salt. I've decided to share this, mostly because I think it would be fun to see what reactions I'm going to get out of this. But I've started to lose motivation for playing this game, because it has become an endless grind and because it was no longer about knowledge and science, but beliefs. "In God we trust, all others must bring data."
There are those who think knowledge is power and should be consolidated to lift oneself above the others. I think knowledge is power, but can be used to lift everyone up instead. The data below was the culmination of about two weeks of work and subsequent analysis, and a couple particularly helpful lightbulb moments. It was hard work, but without some critical thinking, we might still be at the "We need a million data points in order to get any real idea of your returns" phase.
Thanks to @miathan for providing the python script for parsing and tabulating the data, and @minim for their input in data as well.
Motivation: To determine the impact of efficiency and looter level on tt returns, and tease out any obvious trends.
Procedures:
Weapons with three different efficiencies were selected (92.5%, 62.8%, and 29.5%). Each weapon was run on three different mobs (bristlehog, drones, thorifoid berserkers) where I was able to hunt without armor and healing (using lifesteal). The distribution in multipliers were extracted and analyzed. The main region of interest of the distribution fell beneath 1.0x, so see the figure below for an example of such a distribution:
As you can see, the multipliers distributions have groupings. By analyzing the mean and standard deviation of the most populated grouping (Between ~.33x and .63x), we can try to find some trends in looter/efficiency behavior...
Number of kills (samples) performed in each case is shown in the table below:
While I was able to get some really decent results by analyzing only certain multiplier groupings, or certain fractions of the multiplier groupings (e.g. the bottom 2% of multipliers in a group), it did become apparent that I would need maybe quadruple the number of data points to get data that was going to be clean enough. While this is not on the order of 1 million kills, this was still very time consuming and I wasn't about to throw another 5 weeks into this project if I didn't have to.
At this point, I realized that instead of trying to statistically analyze the mean/sigma of the distribution, I could take the very bottom multiplier I got out of the entire sample. and this generally behaved extremely nicely and within my expectations for pretty much all the samples. While not as statistically robust, I found this method to give me the best results, so this is what I went with. The resulting data is in the following figures and explanations.
As you can see, at all the looter levels considered here, efficiency scales linearly. The slope here represents the impact of efficiency on the multiplier. If we take the slopes and divide by the y intercept, we get 7.25%. As MA has stated before, the expected efficiency effect is about 7% full range, so this value seems to align well with what MA has suggested before, as well as my previous turret testing when extrapolated out to 100%.
Teasing out the impact of looter is a bit more complicated but as we can see here, there's an obvious effect of looter levels on multipliers and it is very apparent. We can take the intercept and plot them on another plot. This would effectively represent looter impact at 0 efficiency:
I was quite happy to see that the points all fell on a line. I had some doubts about whether all the professions for looter fell on the same scale, but would seem that they do, which simplifies testing. To consider the effect of looter up to lvl 80 animal looter which is what I have, I take the slope here
It is quite interesting that it appears the impact of looter level and efficiency are approximately equal in scaling between 0 and 100...
Discussion (Take these with a grain of thought, as some of this is based on my opinion of what the looter system might look like extrapolated out to higher levels.)
Based on this data, it appears that both efficiency effect and looter effect are linear. In addition, robot, mutant, and animal looter all appear to lay along on the same scale.
Assuming MA had foresight based on what problems loot1.0 caused, I'd expect some capping eventually of looter level effect. (No proof of this, until I can get to higher looter level). But based on other aspects of the game having lvl100 as a max (eff, weapon reqs), lvl 100 doesn't seem to be unreasonable. Again, I'd have to test this as my looter level moves up.
Just for shits and giggles, I assumed at lvl 100 + eff 100 is 100% TT return. I built a table with either the impacts either being multiplicative or additive ( so looter effect times efficiency effect versus looter effect plus efficiency effect). Here's what it might look like...totally just for fun. While this represents the trend, I have no idea what the tt return should be at 100 looter and 100% efficiency so this is just a proposed possibility
<ERRATA'ed: NEW TABLE, taking into account 7% effect over looter range 0-100 instead of 8.5%...)
Hopefully, this will help elucidate some stuff about eff and looter.
Many others who have been willing to take the time to collect the data, and then to share it with the player base have come before me, and I hope there will be others who share this path with me. I hope to work with others to understand better the mechanics in EU in the future.
Yours truly,
Zho
20220303: Errata: Adjusted looter vs multiplier line to show larger number of decimal places, which reduced the amount of looter prof effect on tt return. I have updated the post to reflect the updates.
20220911 Update: I was able to perform the test at three additional points as my looter level has increased. The same method was used as before, where I extract the lowest multiplier out of a set of mob kills using the reaper blade. The number of samples (kills) at each looter level is shown below, along with the raw data. For the most recent data (highlighted in yellow), since I used reaper blade only and did not bother with additional weapons, I took my previous results showing that 0-100 efficiency results in ~7.25% TT difference, and extrapolated my new data to 0% efficiency to match my previous data which I extracted using a line fit and grabbing the y-intercept.
The plot with a linear fit is below:
Based on the data above, we can assume the linear trend is true at least up to level 87 looter which is my highest looter level. The above slope translates to ~7.17% from 0-100 looter level, which agrees with my previous result with only 3 points. All different looter profession levels look to fall on the same line, so my guess that all looters are on the same scale still holds. Finally, I did switch up the robot looter points from drones to drill bots. This test shows that mobs on different planets should have the same returns, as the point falls right along the line, as expected. Finally, I continue to see the same impact from high efficiency, so I do not see any evidence of efficiency having less impact at higher looter.
My next test probably won't happen until I hit level 100 animal looter, as I see no point testing until I get there. The next goal would be to see if there is an actual cap on looter impact at level 100, and also see if anything about efficiency changes at 100+.
Last edited:
")

